New 5G Services Could Accelerate Cord Cutting in 2019

The rate of consumers dropping their cable and satellite TV packages hit the highest level ever in the fourth quarter of 2017, while Internet TV subscribership grew strongly.

According to analysts at Moffett Nathanson Research, the total number of pay-TV subscribers in Q4 dropped 3.4% from a year earlier, the highest rate of decline since the trend of cord cutting emerged in 2010, with almost 500,000 customers leaving in the fourth quarter alone, that leaves the industry with about 83 million cable households.

These calculations don’t include the growing number of households that never subscribed to a pay TV service in the first place, AKA: “Cord Nevers”. Over half of cord nevers are millennials, ages 18 to 34, but just 35 percent of cord cutters are millennials.

The cable bundle has become increasingly unappealing as consumers have turned to more flexible and less expensive video offerings, disrupting the traditional cable TV model, like Netflix and Hulu that feature traditional TV and movie formats, to shorter programming from YouTube, Facebook, and Snapchat.

But offsetting the shift is the growing number of people signing up for packages of TV channels delivered over the Internet by services like Google’s YouTube TV, Dish Network’s Sling TV and AT&T’s DirecTV Now. At about $20 to $50 per month, the online offerings are considerably cheaper than the average cable TV bundle.

Later this year Verizon, T-Mobile, and AT&T will all be launching 5G networks creating real competition among home internet services. Instead of having one or two options to choose from, consumers will have 5 or more broadband services options, driving a new wave of cord-cutting as consumers continue to unbundle internet services from their local cable company.

12 Big Trends Shaping the Future of Digital Advertising

Mary Meeker presented the most anticipated Powerpoint deck of the year at the annual Recode Code Conference last Wednesday. Below are the big trends she highlighted that will shape the future of digital advertising.

  1. Mobile Growth May Have Peaked
    2017 was the first year in which smartphone unit shipments didn’t grow at all. As more of the world become smartphone owners, growth has been harder and harder to come by. The same goes for internet user growth, which rose 7 percent in 2017, down from 12 percent the year before.
  2. Digital Time Spent is Increasing
    People, however, are still increasing the amount of time they spend online. U.S. adults spent 5.9 hours per day on digital media in 2017, up from 5.6 hours the year before. Time spent on mobile has reached 3.3 hours a day, which is more than double from 1.6 hours in 2012.
  3. Search is Evolving
    49 percent of product searches now start at Amazon—36 percent start on a search engine. What’s more, Amazon is better poised to capitalize on those searches with features like one-click purchasing, which encourage consumers to use Amazon to fulfill orders that result from those searches. Search engines and content sites do a better job of inspiring consumers to want things.
  4. The Lines are Blurring Between Ads, Products, Content & Transactions
    Online browsing is evolving into buying, fueled by social media. Facebook leads the way with 78 percent of survey respondents saying they have discovered products on the platform, followed by Instagram and Pinterest with 59 percent, Twitter with 34 percent and Snap with 22 percent. What’s more, 55 percent of respondents said they have purchased a product online after a social media discovery.
  5. Google is Shifting to E-commerce as Amazon Shifts to Search
    Google is expanding from an ads platform to a commerce platform via Google Home Ordering. Meanwhile, e-commerce giant Amazon is moving into advertising.
  6. Voice is Going Mainstream
    Voice-controlled products like Amazon Echo are taking off. The Echo’s installed base in the U.S. grew from 20 million in the third quarter of 2017 to more than 30 million in the fourth quarter.
  7. E-Commerce Growth is Accelerating
    E-commerce sales growth is continuing to accelerate. It grew 16 percent in the U.S. in 2017, up from 14 percent in 2016. Amazon is taking a bigger share of those sales at 28 percent last year. Conversely, physical retail sales are continuing to decline.
  8. Subscription Services Continue to Grow
    They’re seeing massive adoption, with Netflix up 25%, The New York Times up 43%, and Spotify up 48% year-over-year in 2017. A free tier helps to accelerate conversion rates.
  9. Data Driven Experiences Create a Privacy Paradox
    Advertising and usability improvements driven by data create what Meeker calls a privacy paradox: Advertising and services are made better thanks to user data, users engagement and value is increased, and regulators want to ensure user data is not used improperly. Technology-driven trends are changing so rapidly that it’s rare when one side fully understands the other, setting the stage for reactions that can have unintended consequences
  10. Print Media Continues to Decline
    Since 2011, the share of U.S. media consumption that happens in print has dropped about 40 percent. But the share of American ad dollars that go to print has dropped more than 60 percent.
  11. Disruption is Accelerating
    The speed of technological disruption is accelerating. It took about 80 years for Americans to adopt the dishwasher. The consumer internet became commonplace in less than a decade.
  12. Ai Will Continue to Evolve
    Internet leaders like Google and Amazon will offer more artificial intelligence service platforms as AI becomes a bigger part of enterprise and advertising spending.

Here are the slides:

The Amazon Machine

When you look at large manufacturing companies, it becomes very clear that the machine that makes the machine is just as important as the machine itself. There’s a lot of work in the iPhone, but there’s also a lot of work in the machine that can manufacture over 200m iPhones in a year. Equally, there’s a lot of work in a Tesla Model 3, but Tesla has yet to build a machine that can manufacture Model 3s efficiently, reliable, quickly and at quality at the scale of the incumbent car industry.

More than any of the other big tech platform companies, Amazon is a machine that makes the machine. People tend to talk about the famous virtuous circle diagram – more volume, lower costs, lower prices, more customers and so more volume. However, I think the operating structure of Amazon – the machine – is just as important, and perhaps less often talked about.

Read More

Food is the Top Performing Content on Facebook…

Insight platform Buzzsumo analyzed over 100 million videos published on Facebook over the last year, the research shows just how overwhelmingly dominant video, including Facebook Live video, has become with Food video content outperforming all other categories.

Video Is The Most Engaging Facebook Format

Videos are the Facebook format most likely to reach and engage audiences according to Locowise. The average video post in 2017 reached 12.05% of the total page audience, just ahead of photos at 11.63%, links at 7.81%, and status updates at only 4.56%. Videos also had the highest levels of engagement.

For the majority of publishers, the most engaging content on their websites are traditional text articles.  But when it comes to Facebook, the top performing content is video.

Food Video Generates the Most Facebook Engagement

The most popular video topics ranked by Facebook engagements.Facebook videos that get the most interactionFood is by far the most popular content. These are in effect how-to videos that are well edited with high production value. Food and DIY are visual topics with broad appeal, so they lend themselves well to short videos.

What Is The Optimum Length For A Facebook Video?

The hart below shows that shorter videos generate more interactions on average. The sweet spot for video length is 60 to 90 seconds.Best length for Facebook videos

After 90 seconds average engagement falls as the video length increases, until around 6 minutes when engagement remained constant. It is interesting that very short videos, below 30 seconds generated the lowest engagement on average overall.

What Is The Optimum Length For A Facebook Live Video?

The number of Facebook Live video broadcasts continue to grow rapidly. In 2017, Facebook announced that 20% of all Facebook videos are broadcast live and that the daily watch time for live videos had increased 4x in the last year. This is in part due to the priority Facebook has been giving to live video.

Buzzsumo’s analysis of Facebook Live videos found that interactions increase the longer the video lasts, until about 15-16 minutes. After this time the interactions remain fairly stable.Best length for Facebook live video

Facebook Live Videos are typically longer than other Facebook videos. Live sessions requires a certain minimum time to allow users to join or discover that the event is taking place. From the data it would appear that Facebook Live videos should be a minimum of 15 minutes to gain maximum engagement.

Looking at just the top performing 10,000 Facebook Live videos, the average length was 20 minutes long.

Cord-Cutting Continues to Explode

American consumers are cancelling traditional pay-TV service at a much faster rate than previously expected, according to research firm eMarketer.

In 2017, a total of 22.2 million U.S. adults will have cut the cord on cable, satellite or telco TV service to date — up 33% from 16.7 million in 2016 — the researcher now predicts. That’s significantly higher than eMarketer’s prior estimate of 15.4 million cord-cutters as of the end of this year. Meanwhile, the number of “cord-nevers” (consumers who have never subscribed to pay TV) will rise 5.8% this year, to 34.4 million.

“Younger audiences continue to switch to either exclusively watching [over-the-top] video or watching them in combination with free-TV options,” said Chris Bendtsen, senior forecasting analyst at eMarketer. “Last year, even the Olympics and [the U.S.] presidential election could not prevent younger audiences from abandoning pay TV.”

Overall, 196.3 million U.S. adults will have traditional pay TV (cable, satellite or telco) this year, down 2.4% compared with 2016, eMarketer predicts. By 2021, that will drop to 181.7 million, a decline of nearly 10% from 2016. The number of pay-TV viewers 55 and older will continue to rise over the next four years, while for every other age cohort the subscriber numbers will decline.

By 2021, the number of cord-cutters will nearly equal the number of people who have never had pay TV — a total of 81 million U.S. adults. That means around 30% of American adults won’t have traditional pay TV at that point, per eMarketer’s revised forecast.


For the TV biz, there’s another worrisome trend: People are watching less traditional television. For the first time, in 2017 average TV viewing in the U.S. is expected to drop below 4 hours per day, eMarketer predicts.

Average time spent watching TV (excluding digital) among American adults will drop 3.1%, to 3 hours 58 minutes this year. Digital-video consumption, meanwhile, continues to climb. U.S. adults will consume 1 hour 17 minutes of digital video per day on average in 2017 (excluding time spent viewing video on social networks), up 9.3% year over year, according to eMarketer.

This year, TV advertising will increase just 0.5%, to $71.65 billion (versus the firm’s previous $72.72 billion forecast). As a result, the TV sector’s share of total U.S. media ad spending will drop to 34.9% (vs. 36.6% in 2016) and is expected to fall below 30% by 2021.

The Top 10 Ads on YouTube in 2017

YouTube has released its list of the most popular ads of 2017, ranking the most-watched YouTube ads worldwide.

“No longer constrained by traditional ad lengths, ads are becoming more cinematic and story driven blurring the lines between content and advertising. According to YouTube, this year’s totals are more than double the total time of last year’s top ads,”

1. Samsung India Services: We’ll take care of you wherever you are (150.3M views)

2. Clash Royale: The Last Second (110.7M views)

3. Dude Perfect: Ping Pong Trick Shots 3 (90.6M views)

4. Miss Dior: The new Eau de Parfum (43.0M views)

5. Budweiser: Born the Hard Way | 2017 Super Bowl ad (28.5M views)

6. Kia: Hero’s Journey | 2017 Super Bowl ad (25.9M views)

7. Adidas: Original is never finished (25.4M views)

8. Apple iPhone 7: The Rock x Siri Dominate the Day (25.3M views)

9. Levi’s: Circles (22.3M views)

10. Mr. Clean: Cleaner of Your Dreams | 2017 Super Bowl ad (17.6M views)

How the Disruption of Cable will Change TV Forever.

Paying for TV has been a curious consumer phenomenon. There was a time when TV was free to consumers. It was delivered as a broadcast over-the-air and paid for either by commercials (US) or by taxes on viewers (Europe mostly).

The big shift was convincing consumers to pay for something that used to be free. The initial benefit was that the quality of the picture would be much better. The second benefit was an increase in the number of channels. VHF and UHF television would cover about three and 5 channels respectively while cable could offer dozens, many specializing on specific types of content like the Home Box Office (HBO) offering movies and ESPN offering sports only and MTV music videos and CNN news only.

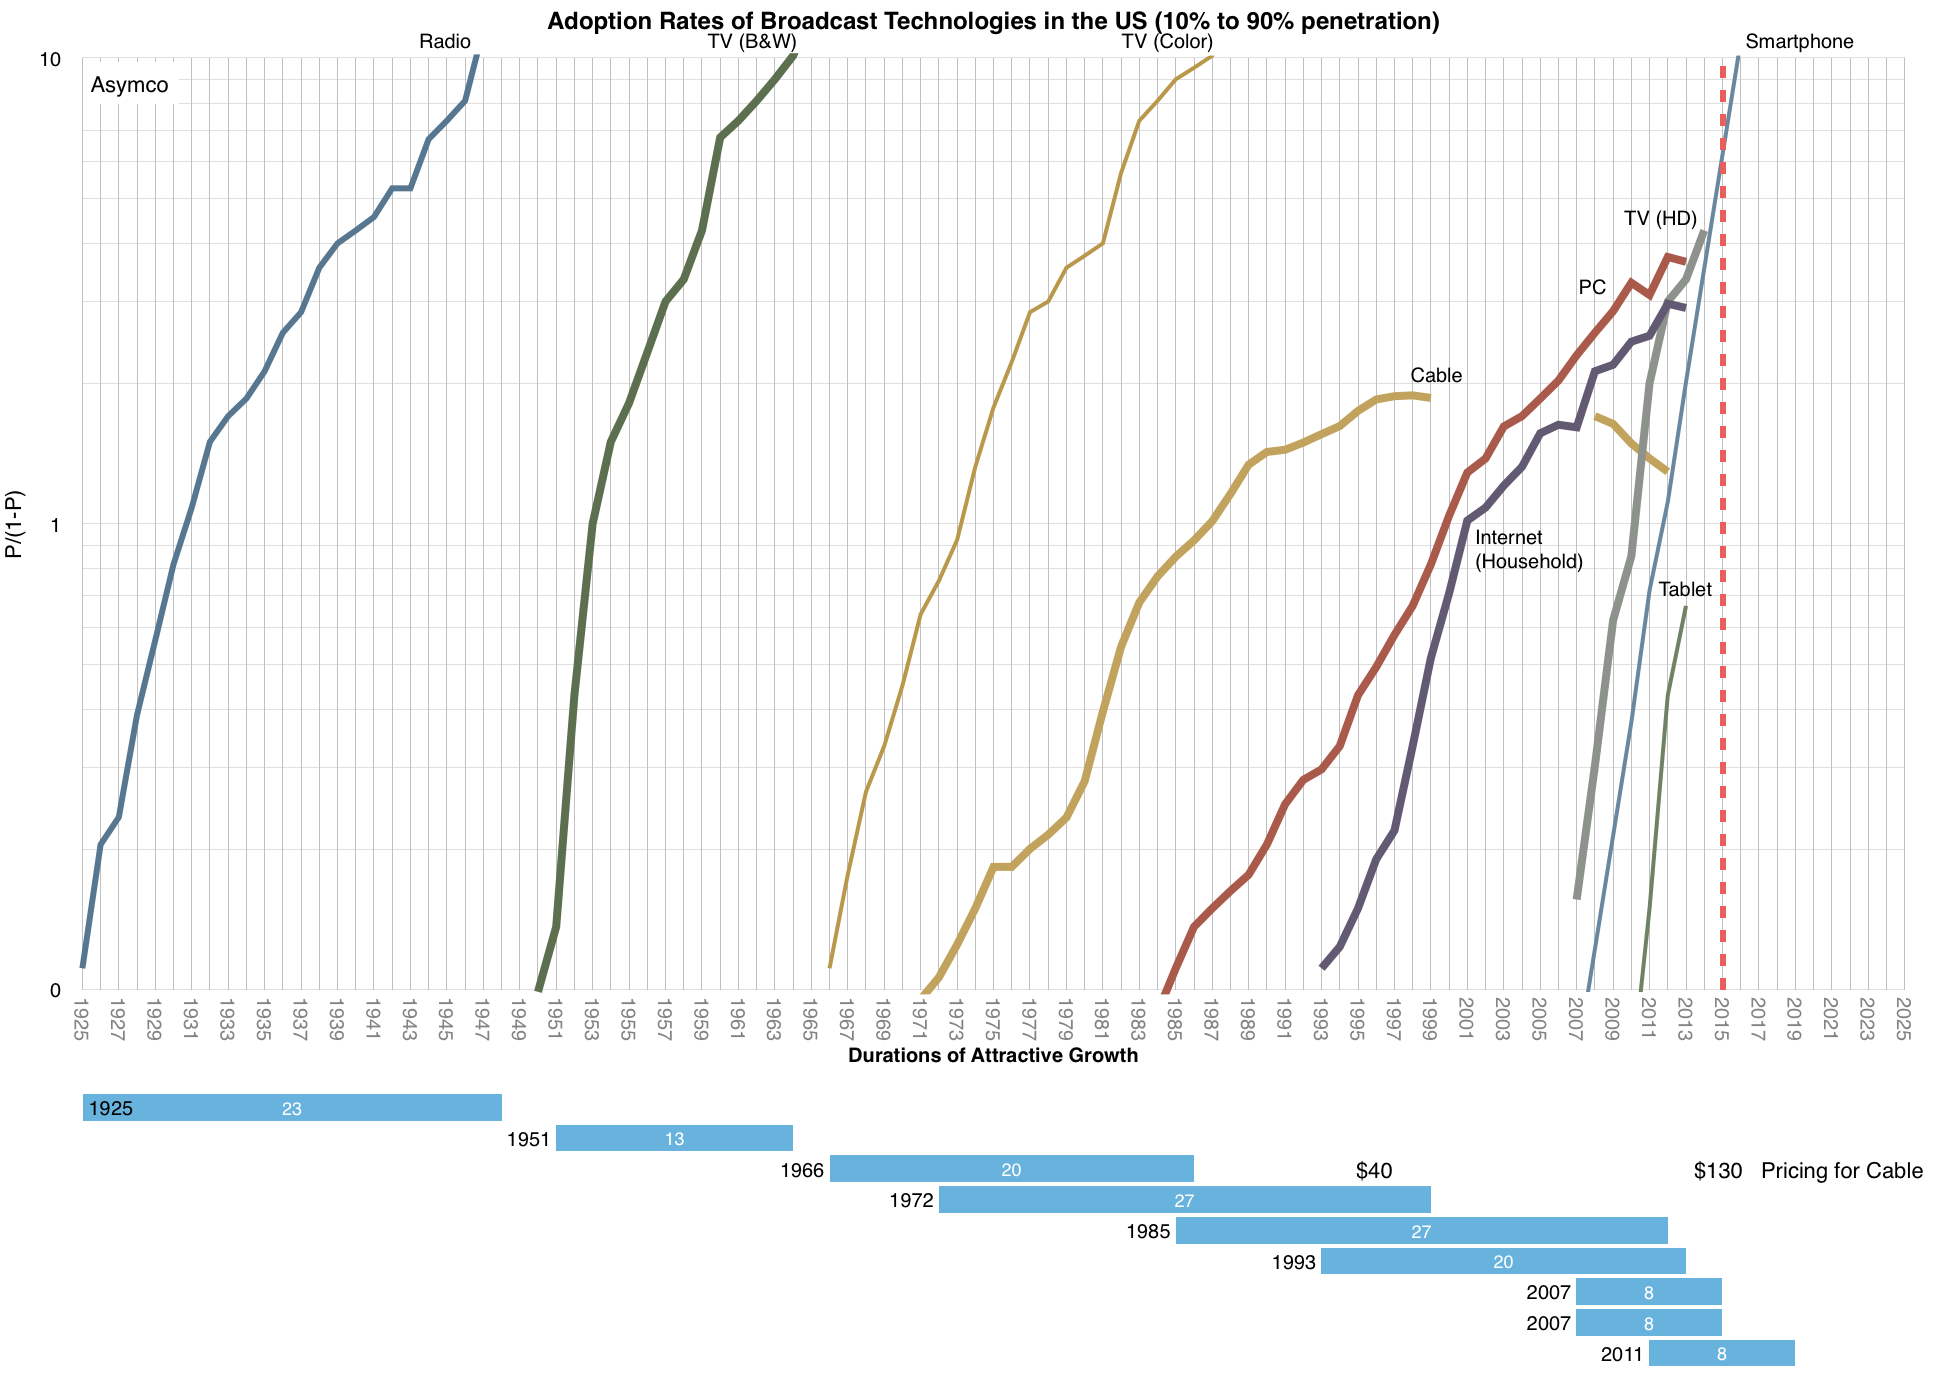
These benefits were very attractive during the 1980s, to the extent that about 60% of US households adopted cable. An additional group later adopted satellite-based pay-TV as the technology became reasonably affordable.

Screen Shot 2015-03-19 at 2.29.06 PM
These benefits were priced modestly but as the quality and breadth of programming increased, prices rose. An average cable bill of $40/month in 1995 is $130 today. Some of that revenue went into upgrading the capital equipment and higher production values, but more went to the sports leagues and their players whose business models increasingly depended on broadcast rights.

And so over a period of about 40 years, watching TV went from free to quite expensive. More expensive even than a family’s communications costs (i.e. telephone service.) That’s quite an achievement at a time when technology disruption caused huge price reductions in other goods and services.

Over time, some of the benefits began to be less relevant. Commercials are more abundant than ever. The quality of the TV picture is actually worse due to compression than one might get with over-the-air digital broadcast. Finally, the abundance of channels is beyond anyone’s absorption rate. Those channels which used to be “pure” became polluted and undifferentiated as each tried to be the other.

On top of these paradoxes is the fact that actual penetration of the service has been declining. As the graph above shows, Cable TV has declined (though Pay TV much less so). The industry has reached saturation decades ago and has not offered anything meaningful in terms of innovation.

Disruption theory suggests that once a product over-serves on meaningful bases of value creation (and underserves on value) it opens the door to disruption. Which leads to the question. Has cable past its prime time? Twenty years have passed since the industry reached saturation and prices keep rising. The average cable bill is projected to rise to over $200/month by 2020.

This has left the industry open for disruption. Users are cutting cords, the “uncabled” or “never-cabled” are a significant portion of the population. 13.5% of broadband households with an adult under 35 have no pay-TV subscriptions. 8.6 million US households have broadband Internet but no pay-TV subscription. That’s 7.3% of households, up from 4.2% in 2010.  Another 5.6 million households “are prime to be among the next wave of cord-cutters,” according to Experian.

The same phenomenon occurred with mobile vs. fixed telephones. For several years it seemed that mobile was sustaining to fixed or that fixed was immune due to lock-ins. The fixed telephone incumbents insisted that the data was inconclusive. Then the trickle of abandonment turned into a waterfall. The quality of service for mobile kept increasing and, with data, it became clear that the mobile devices could unleash a new wave of functionality and value. The same phenomenon occurred again as the music industry shifted from CD’s to digital.

And so it goes. A business dies first slowly then quickly. The exact timing is tricky because of the non-linearity of the phenomenon. It’s also hard to declare end-of-life since business zombies will try to hold on to life as long as possible. What is clear however is that the economics will change dramatically and the alliances between talent and distribution will shift to entrants and away from incumbents. The point when we look back and say that cable as we know it was finished could come by the end of this decade.

10 Big Tech Trends in Food

10) Digital Dining
Logbar in Tokyo issues customers with iPad Minis upon entry. The menu is on the tablet, which you can also use to communicate with other drinkers and view, “like” and order what they’re drinking. You can even invent your own cocktail and add it to the menu, earning a 50 yen (about 30p) commission when someone else buys one.

9) New Food Bars
Chapul protein bars have introduced the notion of insect-eating to America. They contain 15% more iron than spinach and as much B12 as salmon, and the insects are disguised by other ingredients including chocolate, coffee, coconut and ginger.

8) Laser Cutting
Designer Andrew Stellitano engraves ham, laser-cuts biscuits into Louis Vuitton logos and makes topographic art out of lasagne. It is all rather beautiful, in an unnaturally perfect sort of way.

7) Food Tattoos
A Spanish company has developed laser tattoos for fresh produce, which can safely apply logos, provenance details and even QR codes on to fruit and veg. So long, irritating and un-eco stickers.

6) “Health” Chocolate
With an increasing number of well-off older people wanting to stay fit, bigging up the functional properties of products is considered a good business bet. Expect to see more along the lines of French fruity chocolate Wellness Cacao, probiotic Ohso bars and IQ “superfood” chocolate.

5) Healthy Snacks
Chia, an ancient grain that is favoured by vegan raw foodists as a great source of protein, omega-3, fibre and slow-release carbohydrate, has been morphed into a snack food. Mixed with coconut milk and fruit, it comes in a dinky “pod” with a spoon. Expect to see more chia products for “on-the-go nutrition”.

4) Jerky 2.0
EPIC bars are animal-based protein snacks (turkey, bison, beef) that are billed as highly nutritious, sugar-free and “just like our ancestors’ ate”. “Paleo-diet friendly!”

3) Savoury Yogurt
Carrot, tomato, parsnip and beetroot yogurt are a thing. Milk from grass-fed cows and naturally sweet vegetables seem like a winning combination.

2) Protein Snacks
IPS (Intelligent Protein Snacks) contain protein, half the fat of regular chips and fewer carbs, too. No mention of salt levels, though.

1) 3D printing
The exquisite geometric confectionary sculptures created by The Sugar Lab are just the beginning of what is possible as 3D-printing takes off.

Food Network Launches “Discover Food Network” Channel on SnapChat

https://www.youtube.com/watch?v=UbOMqA2AOIk

Popular messaging app Snapchat announced today that it has partnered with top media media brands, including Food Network, in order to launch a new in-app news feature that will allow users to access a collection of the day’s top stories and videos with just one swipe.

The app’s new ‘Discover’ feature includes 12 unique news channels, one for each media partner, plus a dedicated Snapchat channel which will include original content from the app’s creators.

With the move, Snapchat is positioning itself as a media platform — one that reaches an estimated 100-plus million monthly active users. Snapchat Discover will compete with other video platforms and services that encompass video, including YouTube, Facebook and Twitter. Every channel in Snapchat Discover is refreshed after 24 hours, “because what’s news today is history tomorrow,” the company explained.

Food Network is Snapchat’s exclusive launch partner within the food category. The Discover Food Network channel on Snapchat extends the Food Network brand to reach even more young consumers with new and exciting content tailored specifically for that audience. As well as being an engaging new channel for young food fans, Discover Food Network on Snapchat will provide a new opportunity for advertisers to reach engaged young people who love food.

“Food Network has led the dialogue around food for more than two decades, informing and entertaining passionate and engaged fans, and we are excited to bring it to the Snapchat platform,” says Brooke Johnson, President of Food Network & Cooking Channel. “Audiences are more food-conscious than ever before and the Discover Food Network channel on Snapchat will provide users with the great content they love, designed specifically for their mobile devices.”

Users can tap on a channel and swipe left to flip through each channel’s daily edition, containing five to ten stories selected for the service by the Food Network editorial team.

The expectation is that some consumers will discover Food Network content through Snapchat, then seek more through Food Network’s television channels, digital and mobile platforms.

Analyst expects Netflix to reach 100 million global subs by 2018

Stifel Nicolaus analyst Scott Devitt expects Netflix Inc.‘s international subscribers to surpass its domestic subscribers within the next five to six years.

Devitt, who upgraded Netflix to “buy” from “hold” with a $380 price target, believes the company will have about 100 million global subscribers by 2018.

“While 4Q may continue to be bumpy, we believe 2015 will see resumed growth from launches in Western Europe in mid-September 2014, particularly from large countries such as France, Germany, and Switzerland, as well upcoming launches,” the analyst said in a Jan. 13 research note.

The analyst expects the company to expand further in Western Europe, with Spain, Portugal, and Italy being the next likely targets